Product

By
Mel Sheppard
//
19 July 2023

Version 1.15 contains a number of enhancements specifically designed to address some of the pain points with creating and maintaining Squirrel projects.
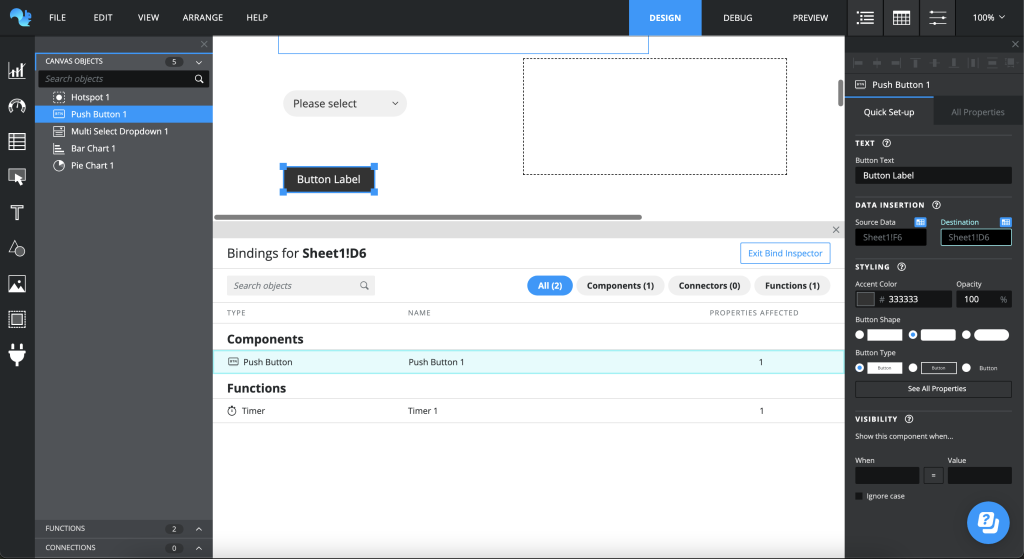
Bulk property editing – As a step towards common property editing, you can now select multiple components of the same kind and change a property across all of them in one go. This, along with the new font switcher, capability makes it easier to style and configure multiple components at once.
Impact analysis – Want to know if something is inserting into that cell? What about formulas that might be referencing it. Impact analysis is here to help and is only the beginning. Impact Analysis is just the start of the enhancements we have planed to make working with and maintaining your projects easier.
Scorecard/data table – The foundations of scorecard and data table have been completely re-written from the ground up. This is in preparation for adding tons more functionality in the future. Your old scorecards and data tables remain un-changed but any new ones aded will be using the new components.
Select multiple objects of the same type and you can now update a property and have it applied to all of the selected items.
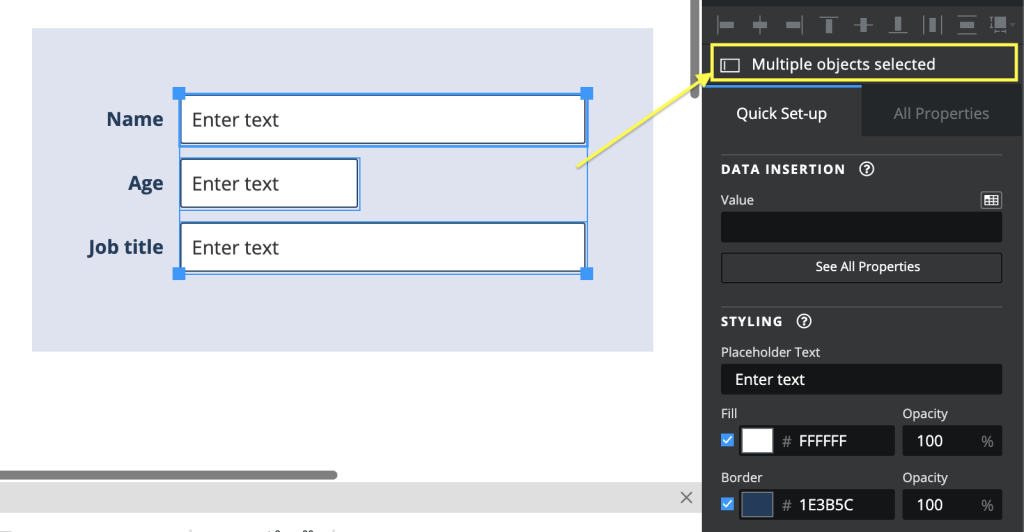
The image above shows 3 Text Input components selected. The top part of the property panel indicated that you are in a bulk property editing mode and and any changes are applied to al of the selected objects.
NB: this currently doesn’t work across groups and containers (i.e. different levels of the object hierarchy)
If you select components of different types then the property panel exposes only the size, position and dynamic visibility properties as these are common across all canvas objects.
Find and replace fonts in bulk using the font switcher.
Changing the font used in a project (especially after you were a considerable way into its creation) used to be painful. Now you can get a list of used fonts and styles and switch then easily for another.
To access the font switcher, from the main menu, go to EDIT > Find & Replace fonts. This brings up the fonts dialogue showing a list of all the font, size and style combinations used in your project.
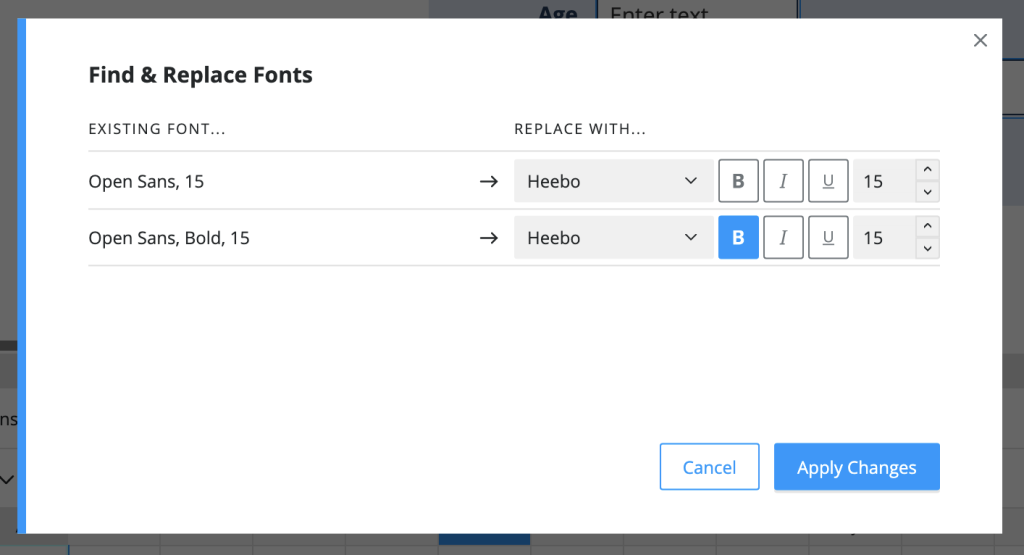
Find the existing font that you want to replace and select the new settings in the ‘Replace with…’ section. When you click apply changes this will update all instances of it.
This action cannot be undone using the undo command. If you want to revert your changes simply go to Find & Replace fonts to change it back.
The new repeat container automatically repeats components in rows and updates the bindings accordingly.
Arrange, style and configure the objects inside the repeat container, including any bindings. Then the magic happens when you bind the container to a range that contains all the values that should be dynamically replaced in the property bindings for each new instance of the object/component.
To make this work your data needs to be in a certain structure. Specifically, organised as a continuous block of data/values.
The repeat container works by looking at the length of the range and repeating its contents for every row that exists in the block. It will loop through and automatically increment the bindings from the original component property.
We’ve extended the conditional logic on dynamic visibility to other areas including triggers. This gives you more precise control over when something is triggered and helping you to keep your spreadsheet logic simple.
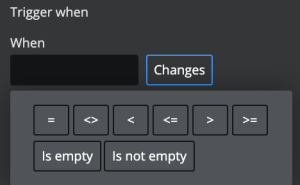
It has also been added to any visual components that have the ‘Disable when…’ option.
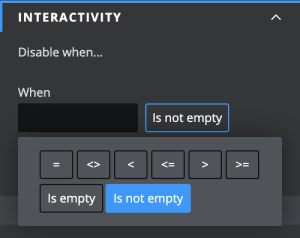
We’ll be adding it to more functions and connections in future releases.
If you’ve ever inherited a .sqrl file from someone else… or even come back to one that you created months ago and wondered how on earth it works. This is the product update for you.
With Impact analysis we’ve made it possible to select a cell in the spreadsheet and find out what components, functions or connections are bound to that cell, or even what formulas are referencing it.
Right click on the cell in question and select ‘Inspect Bindings’.
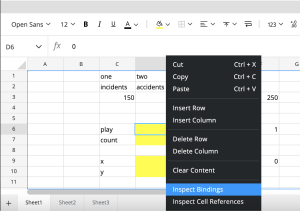
This will open the Bind inspector view and give you a list of all the components, functions and connections that have a property bound to that cell. Clicking on one of the items in this view will select it in the object browser and highlight the any properties bound to that cell in the property panel.
Right click on a cell select ‘Inspect Cell References’ (If this option is greyed out it is because there are no references).
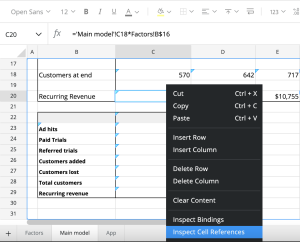
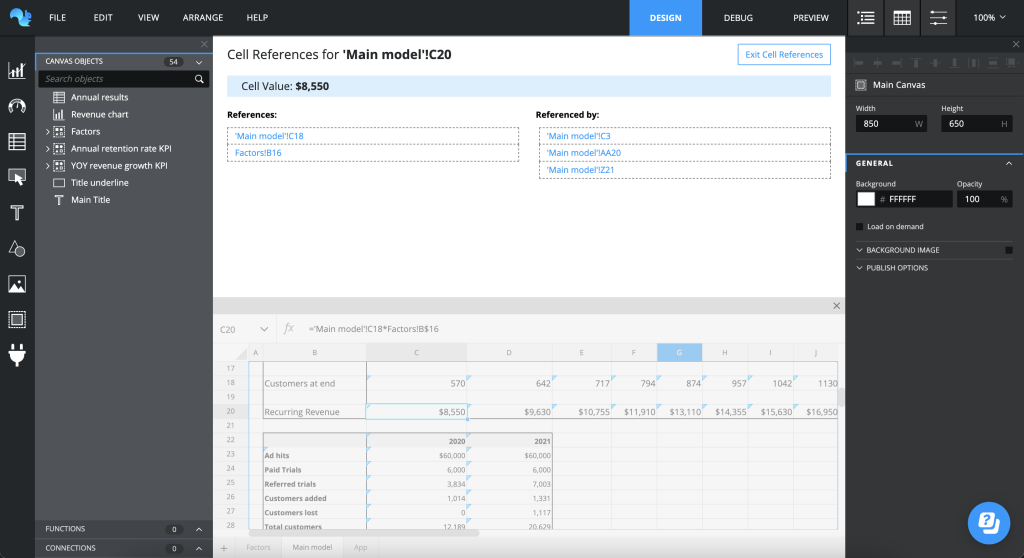
This will open the ‘cell reference explorer’. A panel with 2 lists; References and Referenced By.
The References column contains a list of cells/ranges that the cell you are inspecting uses in a formula. I.e. the cell contains a formula that references these cell/ranges. They are ‘upstream’ of the current formula.
The Referenced By column contains a list of all the cells/ranges that are referencing the cell you are expecting. i.e. the cell is referenced in a formula in another cell/range. They are ‘downstream’ of the current cell.
Clicking on any of the links will navigate to that cell in the spreadsheet and become the subject of the cell reference explorer. Using this method you can traverse up and down the formula tree, tracing formulas though.
In previous versions there was little control over the order in which form elements received focus. Increasingly we are seeing simple forms created using Squirrel and being able to tab into or select those fields using the keyboard and not a mouse is key to both speeding up the workflow for the end user as well as providing a more native app feel.
Form components such as Text Input, Value Input, Check Boxes and Radio Buttons have received a new property called Tab Index.
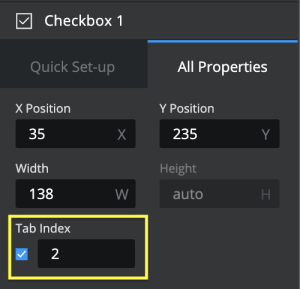
This allows you to manually define the order in which elements on the screen get focus. We’ve added new focus states so that the end user to can follow the focus/cursor more easily.
The lower the number the earlier the order of focus. So, for example, setting something to 1 will ensure it is the first component to get focus. A Tab index setting of 6 will receive focus before components with a tab index of 7 or greater.
By default there is no index value set meaning the browser default behaviour is observed.
Disabling the Tab Index property means the component will never receive focus.
Get information about the operating system, browser, language or full user agent string from your end users. Configure the Browser info function to write this into the spreadsheet for you to make use of in your app/project.
The new Text Area component allows you to capture long form content from you users within your applications.
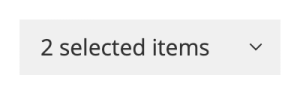
We’ve created a new multi select version of the dropdown for those times when you want the end user to select multiple options but there are too many to list as individual checkboxes. Or you want to use less screen real-estate.
When collapsed the dropdown displays the number of selected items.
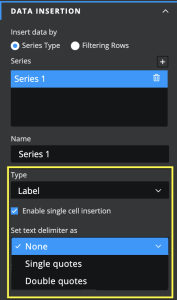
The multi select dropdown includes an additional option for the Label based insertion. Turning on ‘Single cell insertion’ will insert the values as a comma separated list into a single cell (with optional text delimiter). This is especially useful when building a list of values to be passed as parameters in a connector.
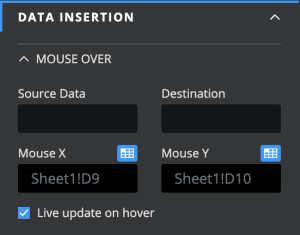
You can now capture the x and y position of the cursor within any hotspot area and insert them into the spreadsheet. Great for tooltips or info boxes that that need to follow the cursor
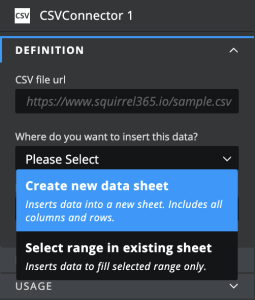
The CSV connector has been enhanced to have the Data sheet option as the destination for your data.
We made lots of little improvements and squished a bunch of bugs including:
GET STARTED
Sign up, get building, and pay when you’re ready to launch.