Product

By
Donald MacCormick
//
08 December 2021

A new type of sheet for your Excel Online and Googles Sheets connectors, Datasheets grow with your data so you no longer need to guess the size of your destination range. They also allow you to fetch data at design time, making it quicker and easier to design and build projects.
When you configure either of these connectors you now have an additional option to create a new “data sheet” to contain the data.
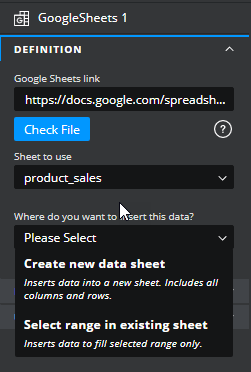
Datasheets are specifically designed and optimised to hold dynamic data read in from connectors. They work in much the same way as any other sheet but are auto-generated. You don’t have to select a fixed range for the data as the full dataset is always read into the sheet.
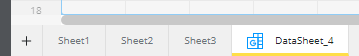
They appear alongside standard sheets and can be identified by the connector icon and yellow underline on the sheet tab. A default name gets assigned but you can rename them to something more meaningful using the right-click menu.
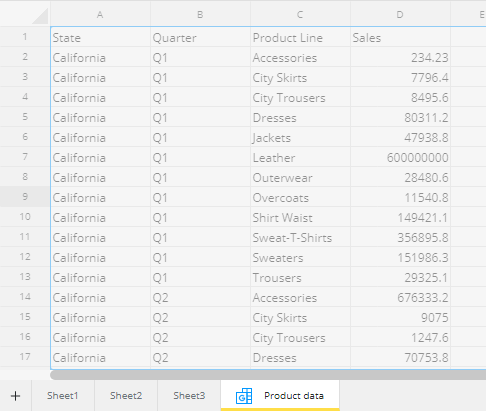
It’s important to note that Datasheets are read-only. This means that you can reference them in formulas and components, the same way as you would for standard sheets, but It is not possible to insert data into them from a component. Nor can you edit their contents directly. The Datasheets are slightly greyed out to serve as a reminder of this.
Viewing the data from the connector at design time is now as simple as pushing the “Sync data sheet” button in the connector’s property sheet:
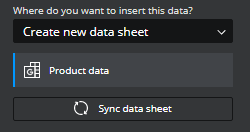
This will load the data sheet with the current data from the connector which makes it much easier to work with the data at design time (e.g. bind it to visual components).
You can now add drop shadows to rectangle and ellipse shape components.

These are controlled by the Effects section of the Styling drawer in the property sheet.
Selecting “Drop Shadow” from the dropdown displays various options to control the styling of the shadow.
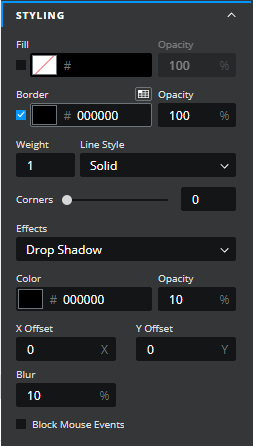
The X and Y offsets are used to alter the position of the shadow, positive values move the shadow right and down, negative values move it left and up.
It is now possible to use the PgUp, PgDn and Ctrl-Home keystrokes to move around the spreadsheet when choosing a binding range for a property.
The main view in the Project Manager could be really slow to load when rendering lots of projects. This has been significantly improved and loads in a fraction of the time.
GET STARTED
Sign up, get building, and pay when you’re ready to launch.