Customer Stories

By
Donald MacCormick
//
13 April 2022
What do you do when you have a great story to tell about your products’ sustainability credentials, which is backed up by solid data, but that data fills many sheets of an Excel workbook and will quickly induce drowsiness in your customer if you try to scroll through it?
This was the situation Gareth Cosker from the Microsoft Surface team in the UK was facing, as he explained in his recent session with us at the Global Excel Summit:
“The challenge is that hardware and everything that goes with it isn’t a simple kind of thing, data is a massive problem. If you are going to present to a customer and you’re going to become a trusted advisor and you’re going to be able to show transparency across the marketplace, it’s not just surface devices that you need to get the data for, you also need to get that for every other Windows 10 device out there, every other competitor within the marketplace and then formulate and visualise that in such a way that the customer can then take that information and make the right choices when it comes to sustainability within their device selection.”
But not only did he have to tame the data, he also needed to present it in the flow of his presentation, i.e. in PowerPoint:
“If you’re presenting in PowerPoint then surely you have to look at software that can integrate into PowerPoint, because you want to keep the flow going, you want to keep that customer engagement”
To solve these issues he turned to Squirrel365:
“what I found from working with Squirrel team is that there is very simple solution to this … that integrates all of that data via Excel into PowerPoint that gives a visual representation … that allows you to make these scenarios clear in front of the customer and have a an impact on them and their understanding of what you offer in terms of the sustainability”
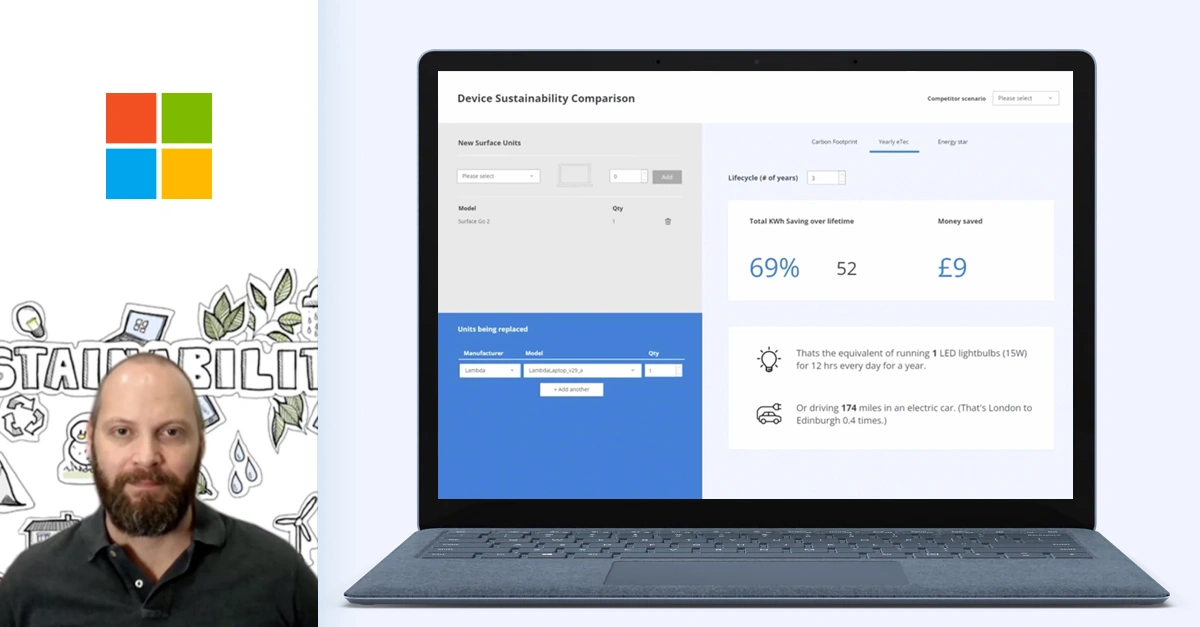
Using Squirrel, Gareth created a sustainability calculator, in the form of a visual app. It allowed him to replicate a customer’s device landscape and interactively show the sustainability impact of various alternative choices, based on data in Excel and all without leaving PowerPoint. This meant that Gareth and the customer could have a real-time discussion about the options:
“in a sales cycle you don’t want them to come back to you a day later and say, oh, actually can you show me what it looks like on a laptop. You want to be able to say let’s do this now. Then I can pull up the different device ranges and the different devices and say, you have a play and tell me what you’re thinking”
All of this was built from an existing Excel workbook using Squirrel using nothing but ordinary spreadsheet logic, with the final result embedded interactively in a PowerPoint presentation with two or three clicks.
If you would like to hear more of Gareth’s story and see his solution in action then the recording of the session is below.
If you want to see what you can do with your spreadsheet knowledge and Squirrel then register for a free account at https://squirrel365.io
GET STARTED
Sign up, get building, and pay when you’re ready to launch.