Thoughts, opinions and handy hints from our expert team.
Product
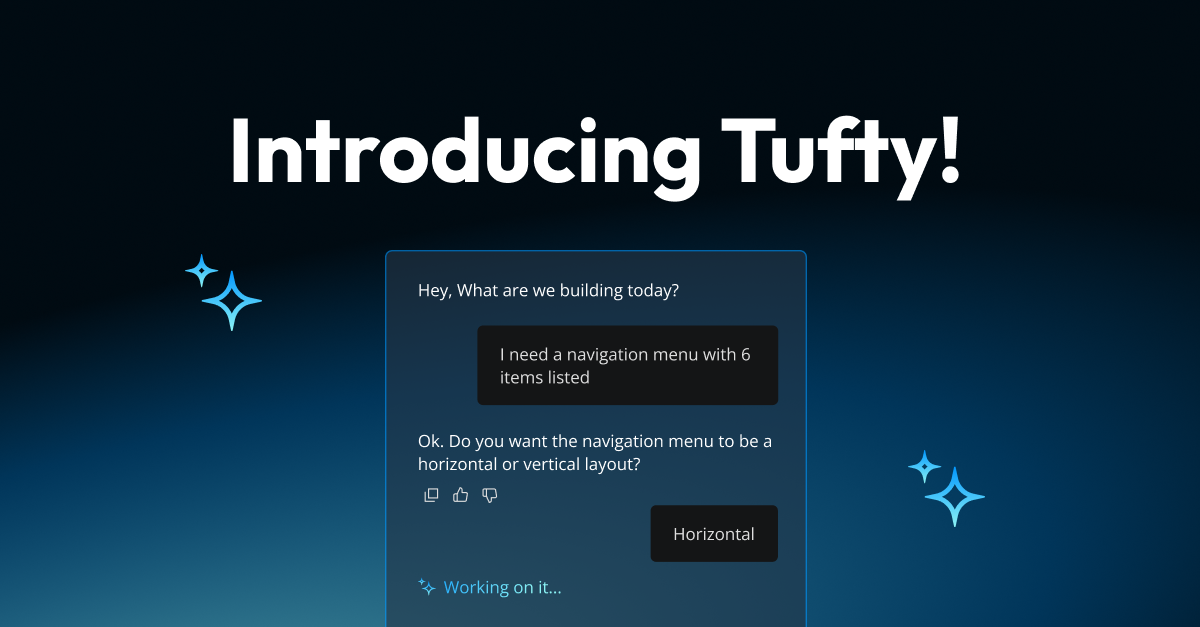
What we learned about Tufty, Squirrel365's new AI agent, when we gave it to users for the first time.
By
Rich Harvey
//
July 10, 2026
Expert Opinion
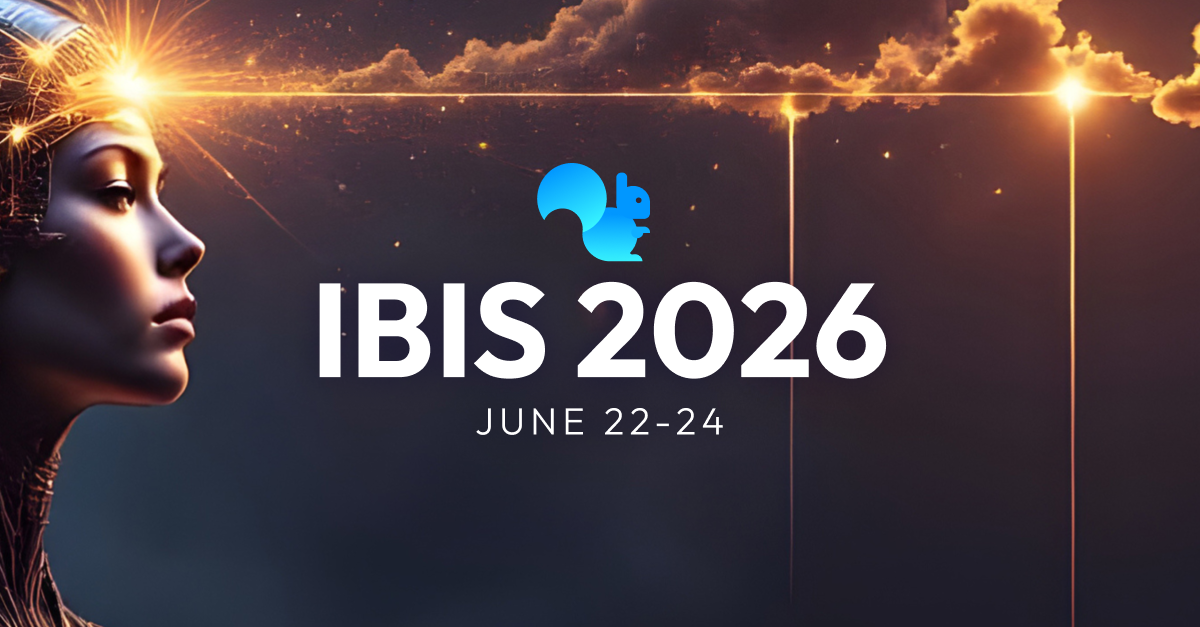
The Squirrel365 team presented at the IBIS 2026 conference in Arizona. Read a round-up of the event and how Squirrel365 featured.
Mel Sheppard
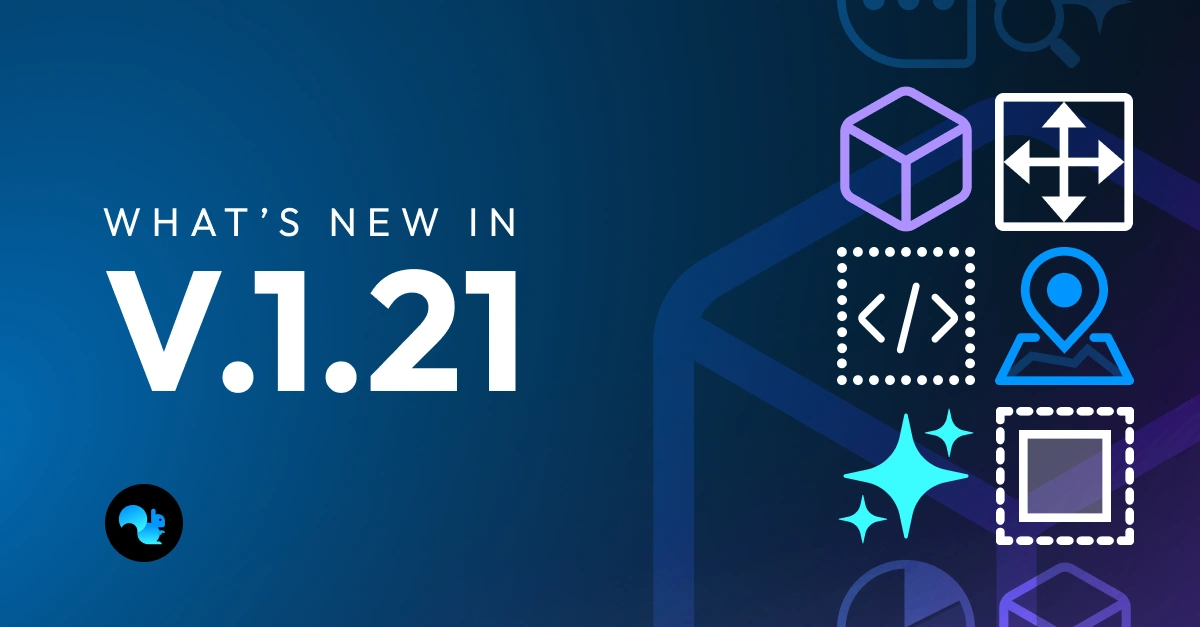
Explore what’s new in the Squirrel365 release including Custom Components, Mapbox heatmap, window size and dynamic container scroll — all designed to help you build better no-code apps.
April 8, 2026
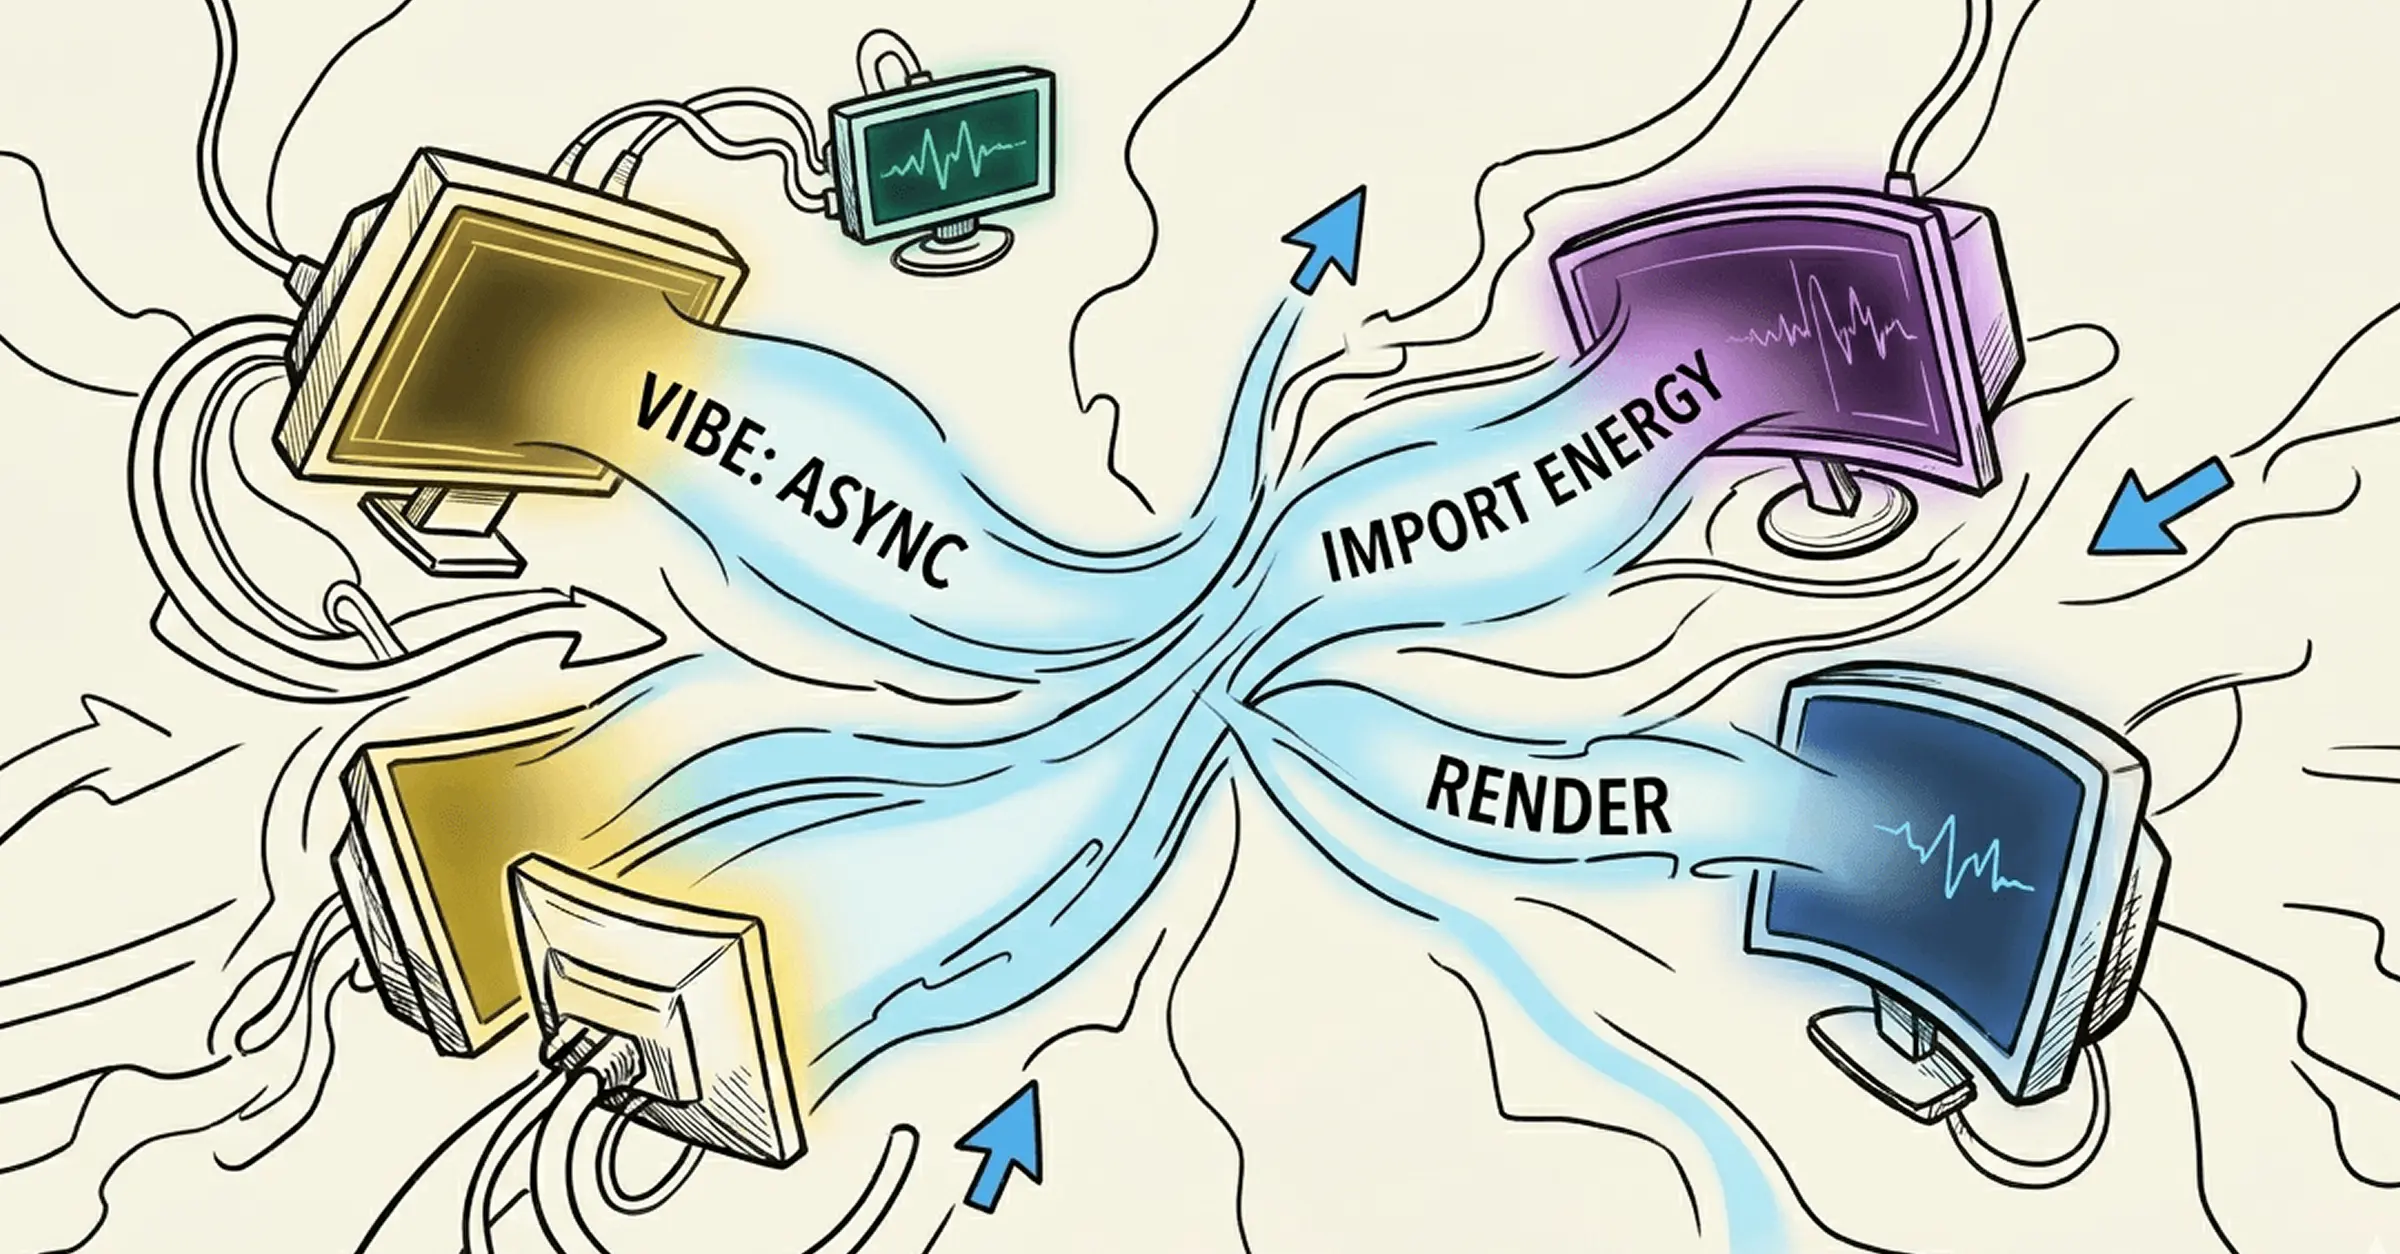
Vibe coding is a way of building software by describing what you want in plain language and letting an AI generate the code for you. You direct the outcome; the AI handles the implementation. If something breaks, you describe the problem and the AI fixes it. The code itself becomes almost incidental.
March 27, 2026
A no-code platform lets you build apps, tools, and dashboards without writing code. This guide explains how they work, who they're for, and where to start.
February 10, 2026
News & Announcements
Squirrel365 celebrates a year of growth, engagement and game changing innovation with our 2025 year in review.
January 8, 2026
Explore what’s new in the Squirrel365 release, with enhanced mobile previews, a rebuilt date picker, AI model support, and a new HubSpot connector — all designed to help you build better no-code apps.
October 8, 2025
GET STARTED
Sign up, get building, and pay when you’re ready to launch.